Air Quality Becomes Hot Topic During Summer Months
To most people, June means moving from spring to summer, but scientists are reminded of another season: this is the time of year when we can start experiencing lower-than-average air quality. This drop is largely due to warmer summertime temperatures, longer days, and increased pollutants being released into the air by cars, trucks, and trains.
Richmond has had some of the best air quality on record over the last several years. We can see that reflected in the following graph.
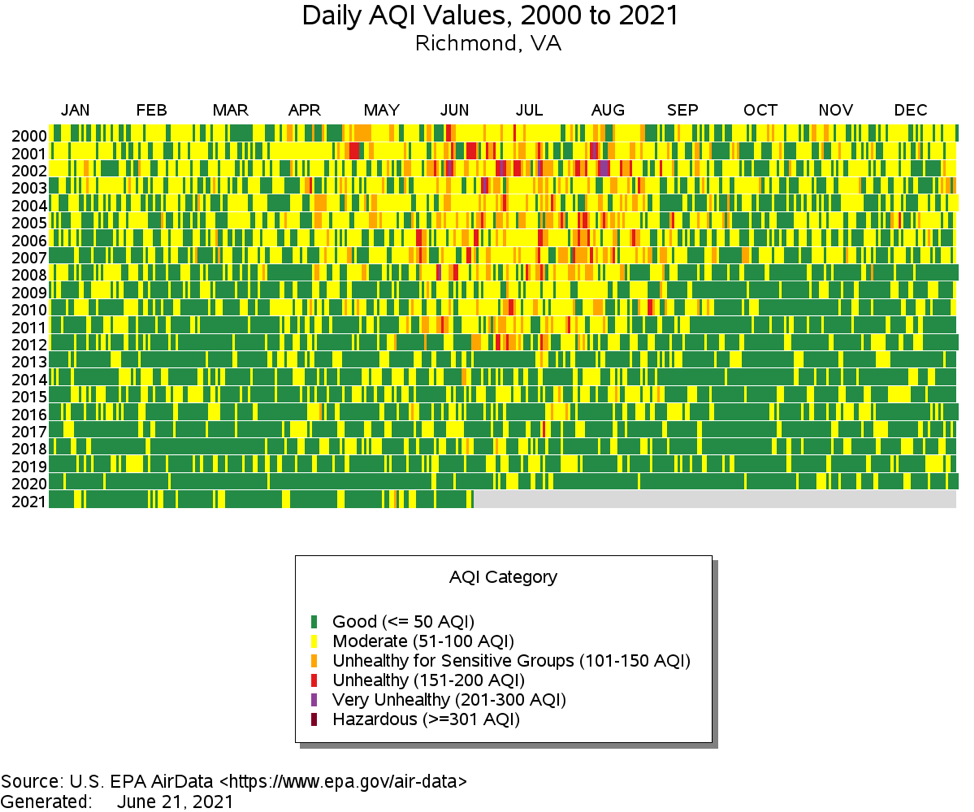
Green indicates good air quality. Much more green is present near the bottom, which are daily observations closer to the present (2021). Poor air quality days (orange, red, and purple colors) were much more common in the early 2000s. A poor air quality day is usually related to higher-than-usual amounts of ozone in the air we’re breathing due in part to the conditions described above. These categories are set by national health standards that relate exposure to these pollutants to adverse health outcomes.
The severity of a poor air quality is related to the color on the chart. Purple represents hazardous conditions to everyone (and usually means we should stay indoors if possible). Orange means unhealthy for sensitive groups, like elderly people and those with chronic respiratory issues such as asthma and COPD. The good news is that Richmond’s air quality has been outstanding by national and international standards for nearly a decade!
Throughout 2020, there were surprisingly few colors other than green. This may be due to a combination of factors, including the large-scale stay-at-home orders that took millions of cars off of our roads. Cars are a primary source of NOx, a key ingredient for generating ozone on the ground. Also 2020 had mild weather conditions that disperse poor air quality quickly, even during the hotter, more humid time of the year.
Richmond and surrounding areas had their first "code orange" air day in over a year in May 2021 due in part to the return of near-normal traffic volumes on our streets as well as weather conditions that favored the accumulation of air pollutants near the ground. Known as an inversion, this is when warmer air sits on top of cooler air, trapping it at the ground.
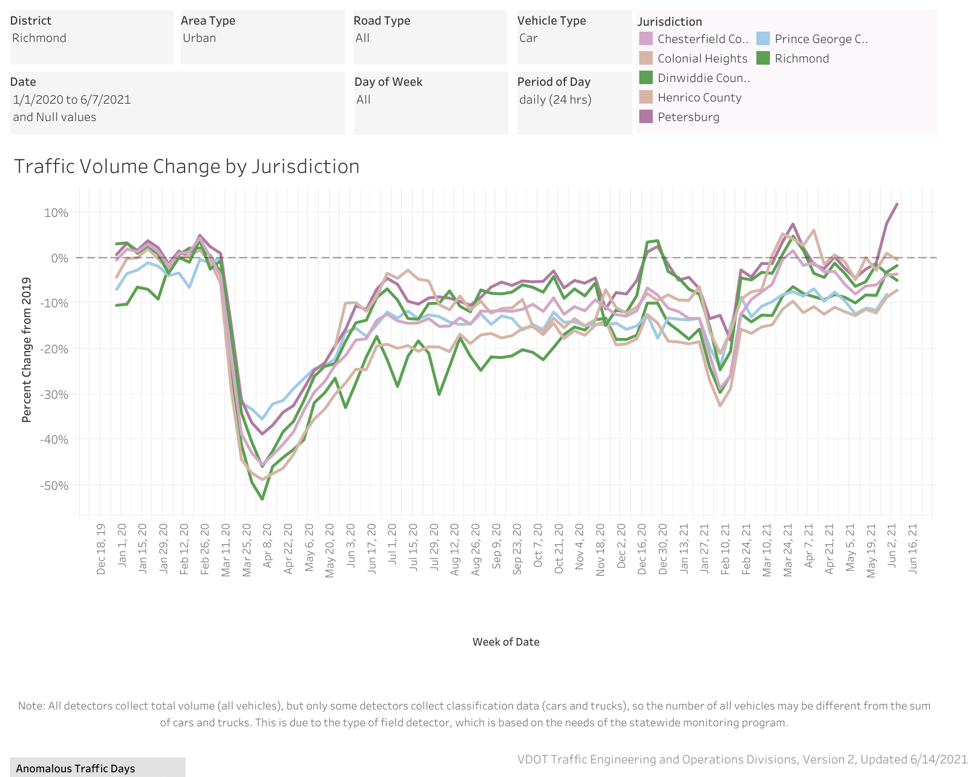
The graph below shows how car traffic is almost back to pre-pandemic levels compared to 2019. The large dip in the colored lines represents the onset of the stay-at-home orders in the early part of the COVID-19 pandemic.
The Museum is working with the Virginia Department of Environmental Quality (DEQ) to better understand air quality in Richmond neighborhoods. Our RVAir program allows community members to use hand-held sensors to collect local concentrations of airborne pollution known as particulate matter (PM), a mixture of microscopic particles in the air that has been linked with cardiovascular and respiratory diseases. This information will be used to help create solutions to Richmond’s climate resiliency challenge, and hopefully continue to add more green air quality days to future graphs.