Check Out Our New Weather Station!
The Science Museum of Virginia just installed Richmond’s newest piece of equipment capable of making observations of the area’s weather – and it’s already broadcasting the data over the internet for us all to observe!
Oh, and it’s made out of 3D-printed material … AND we’re the first Science Museum to get one!
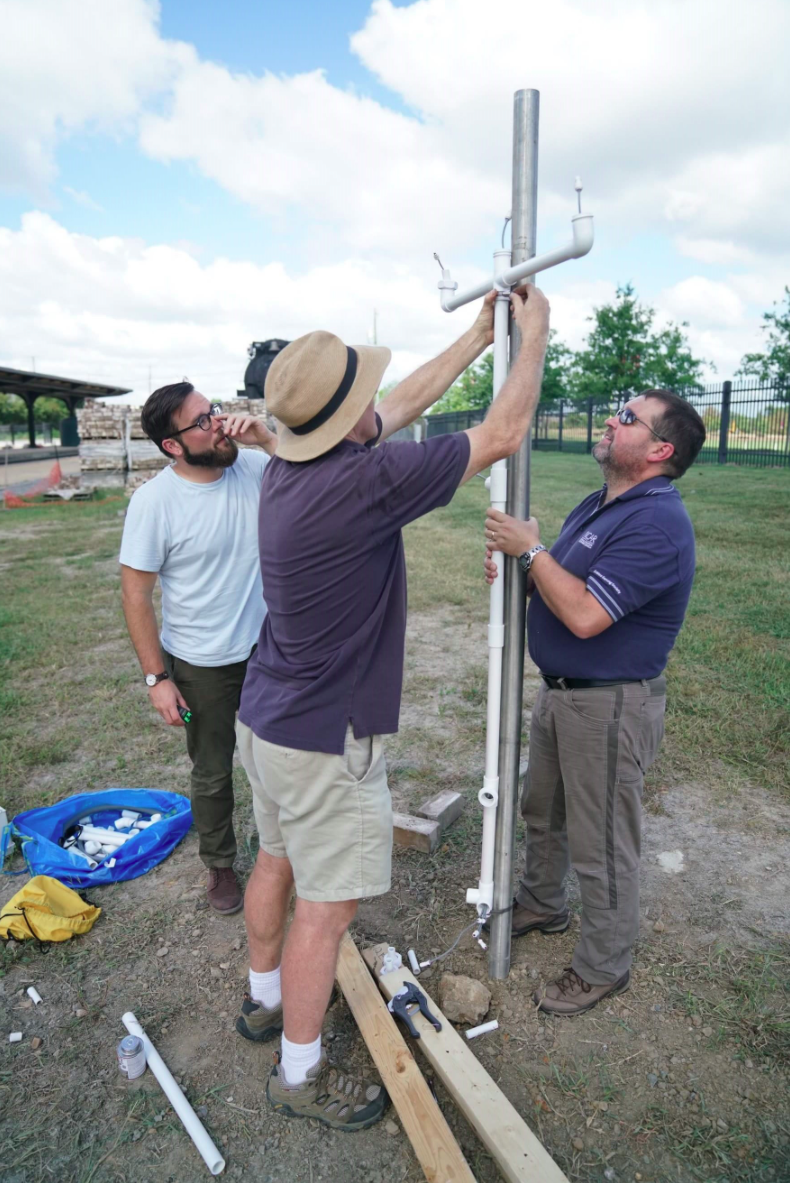
That’s right! In partnership with scientists Dr. Paul Kucera and Martin Steinson from the National Oceanic and Atmospheric Administration, the University Center for Atmospheric Research, and the United States Agency for International Development, Dr. Jeremy Hoffman helped to install a fully-functioning meteorological weather station in the Museum’s backyard.
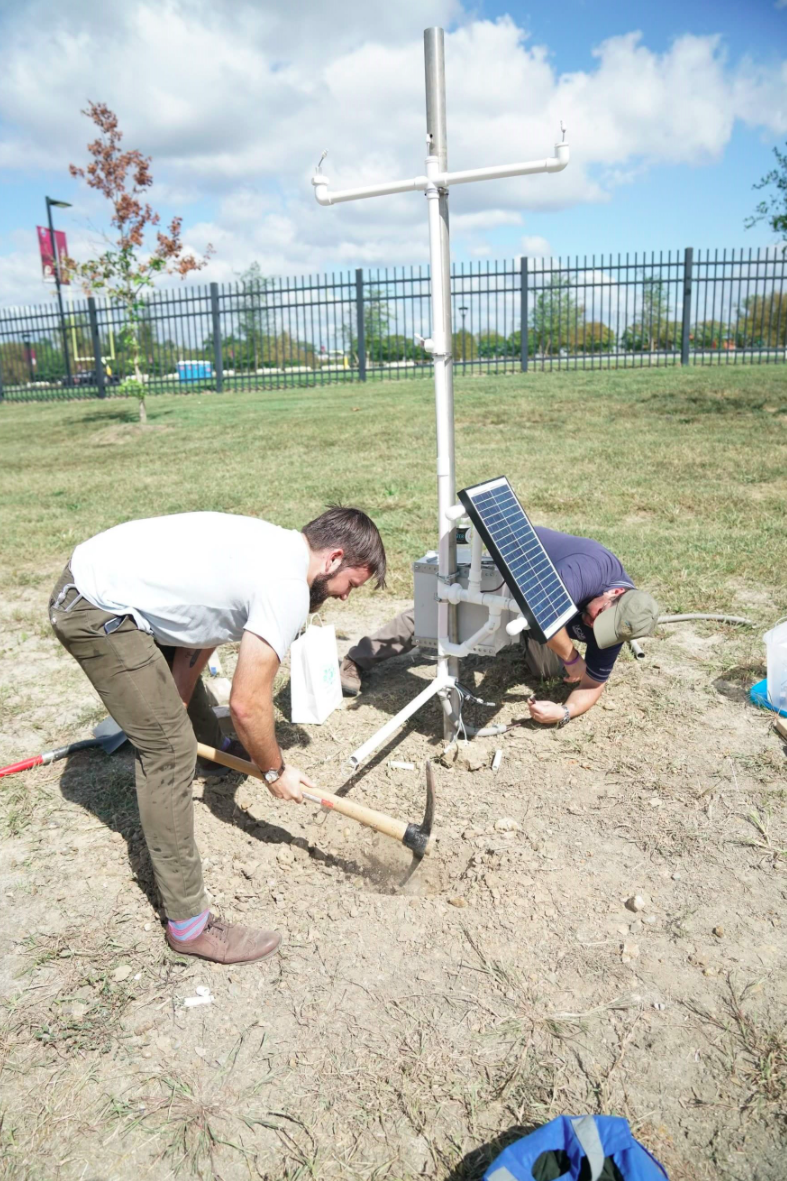
The weather station was installed out by the big steam engine, and it’s visible from the tracks – but be careful, it’s definitely “Science In Progress” and is actively collecting data, so be sure to keep a safe distance away! We’re working on a hands-on exhibit to display its real-time data inside the Museum soon, so for now, check out: http://3d.chordsrt.com/instruments/18 (Does anyone remember how to convert from degrees Celsius to Fahrenheit?)!
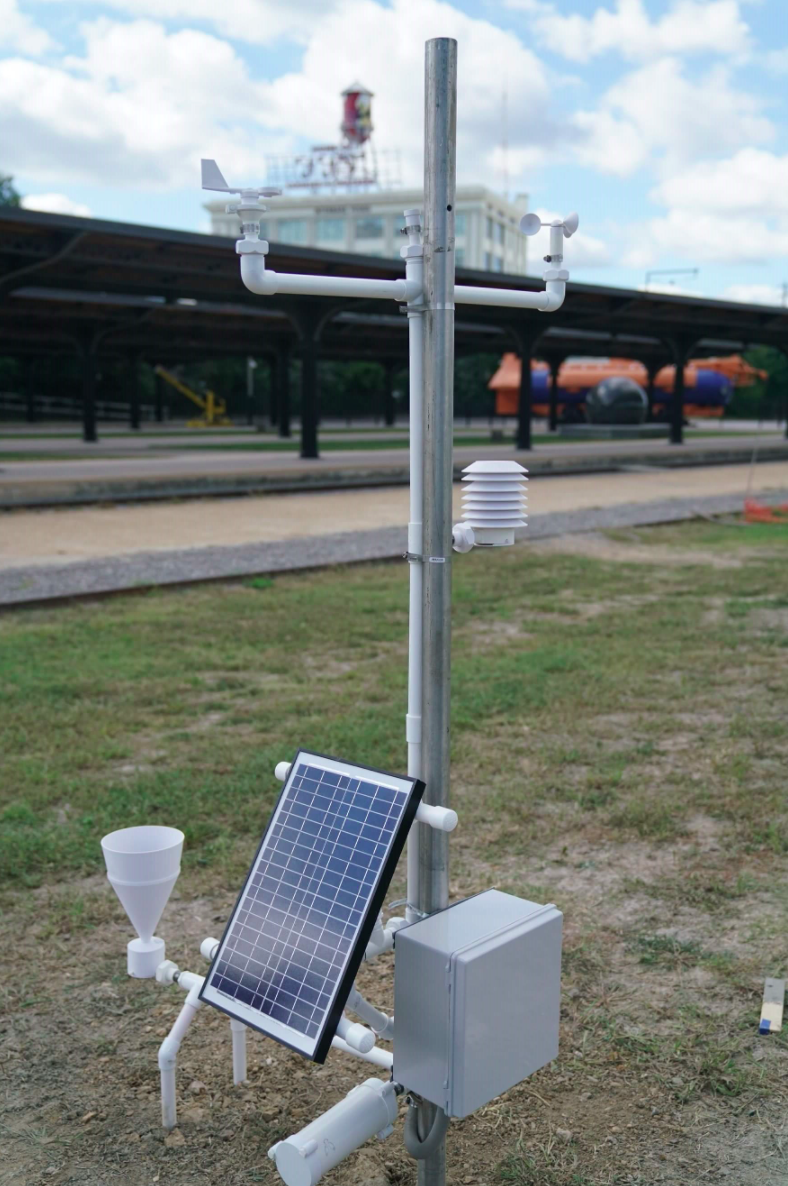
You may see a bunch of other data are being collected as well – relative humidity, wind speed, wind direction, pressure…which parts of the weather station do what, anyway? Well, here’s an explainer of a few key components that will allow our data to be used by meteorologists:
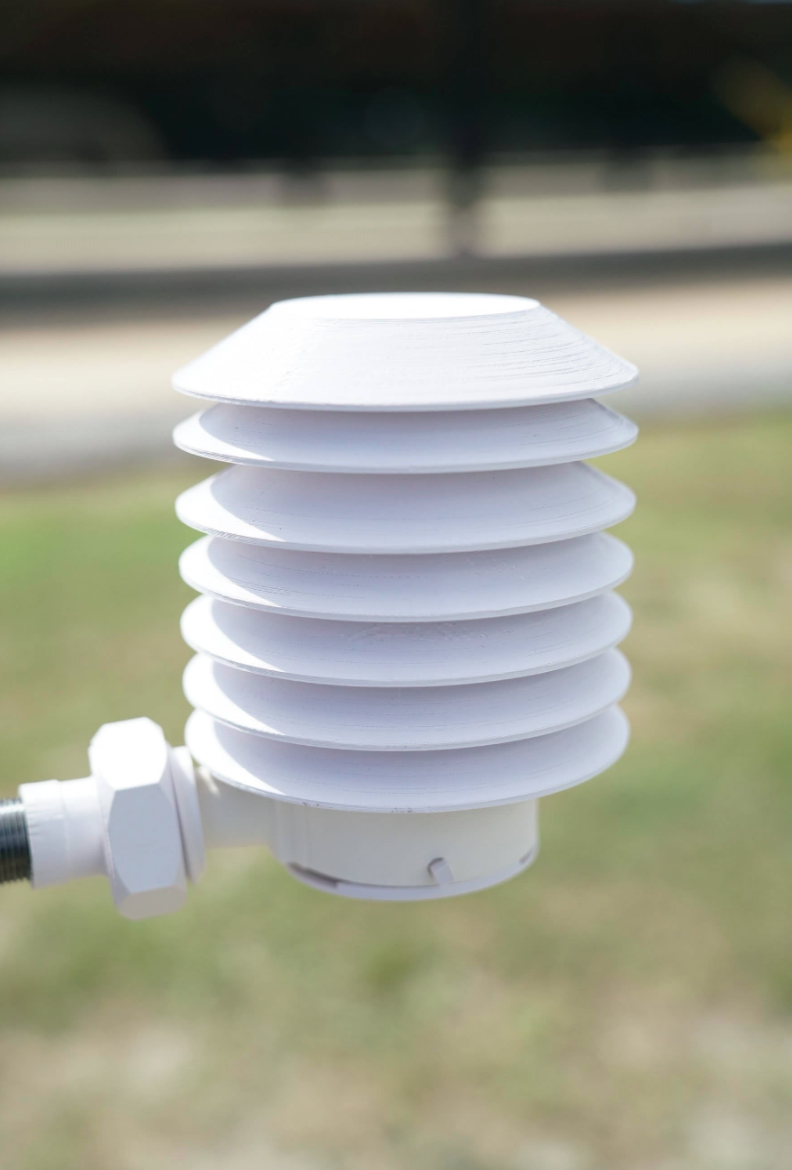
- The temperature and humidity sensors are housed in a solar radiation shield. This piece of equipment is a thermometer and a moisture level indicator (also called a hygrometer, invented by Leonardo da Vinci!) for the air that passes through it. It’s in a solar shield to keep the direct sunlight off it! There are 3 different temperature sensors housed in the solar shield.
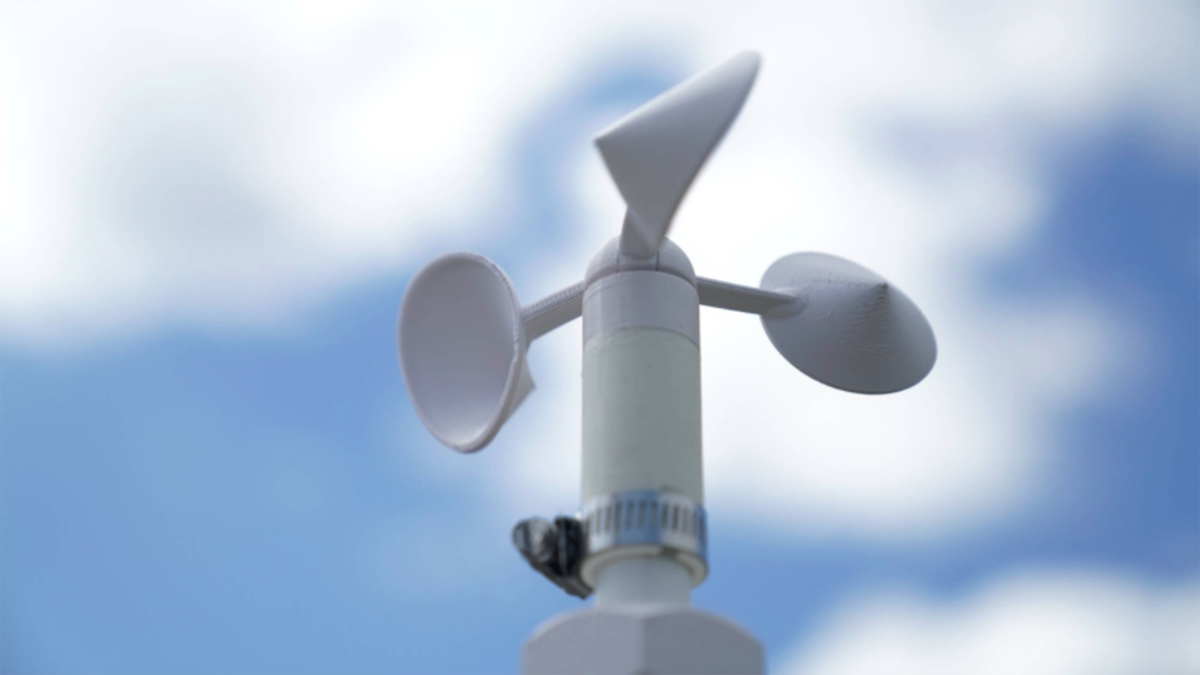
2. The anemometer. This twirling piece of equipment determines how fast the wind is blowing in our backyard. You might remember that Leonardo da Vinci is thought to have invented this sort of technology!
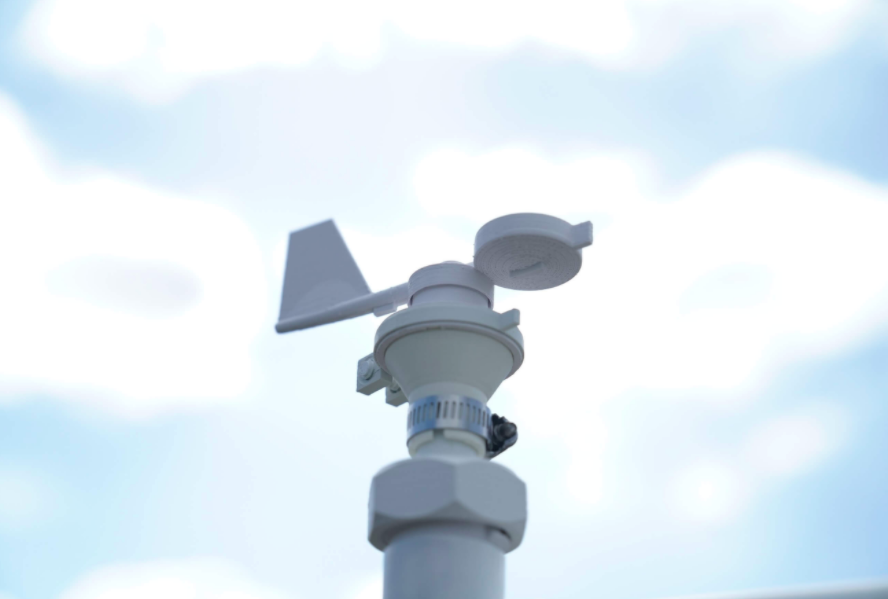
3. The wind vane. This arrow-shaped sensor points in the direction that the wind is blowing from. We “true” this to North by using the shadow cast on a surface during “solar noon,” or when the sun is sitting at its southernmost point during the day (typically also 12:00 pm).
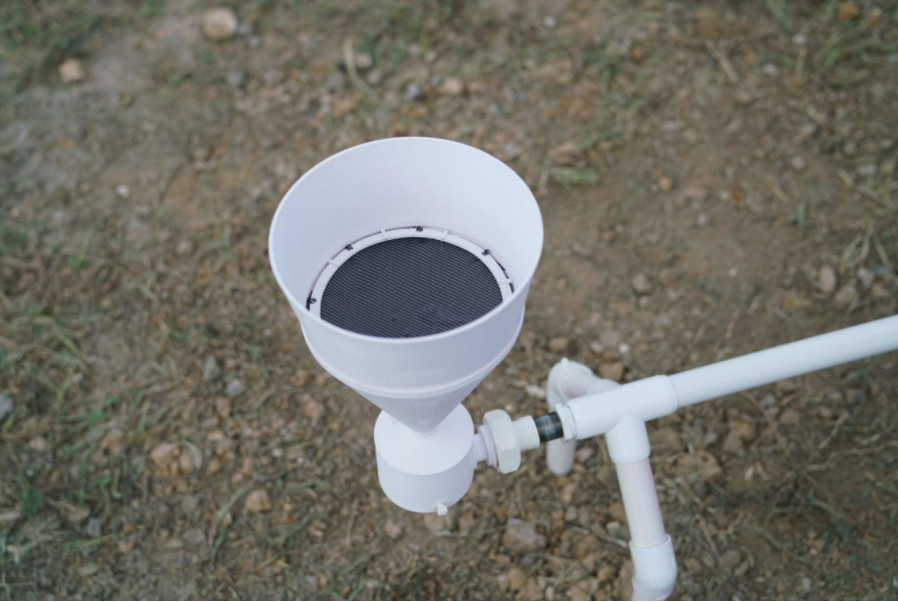
4. The rain gauge. Living in #RVA (anywhere, really) you learn quickly that the amount of rain that falls out at the Richmond airport (what we use as our city meteorological station) may be very different from the rain that falls at your house, and that may even be different from what falls across the street. Indeed, rainfall is a tricky thing to accurately predict for a single spot on the Earth’s surface – which is why we need to measure it better! This cone-shaped piece of equipment is so sensitive that a small amount of water we dumped in it registered on the data stream!
5. The power source – the sun! Our weather station runs on solar power. We have the solar panel angle set to capture the low-angle wintertime sun. Sometime around March 20th, or the vernal equinox, we will re-set the solar panel’s angle lower toward the sun to capture more of the summertime energy (also called “insolation”).
In the near future, the Museum will display these weather data alongside long-term Richmond and Virginia climate data as part of a new permanent space dedicated to Earth Science explorations. In the meantime, keep your eye on the data streaming through the University Center for Atmospheric Research hosting site!